Subtotal $0.00

Magazines cover a wide array subjects, including but not limited to fashion, lifestyle, health, politics, business, Entertainment, sports, science,


Magazines cover a wide array subjects, including but not limited to fashion, lifestyle, health, politics, business, Entertainment, sports, science,

 Fact Checked by Coinsbeat Editorial Team | Expert Reviewed by Themiya
Bitcoin is sitting at $76,049. It’s 40% below its October 2025 all-time high. And the people still shilling a clean recovery path are ignoring two macro freight trains heading straight for the trade.
Let’s be real about what’s actually happening here. This isn’t a crypto problem right now. This is a macro stress test that Bitcoin just happens to be failing in slow motion.
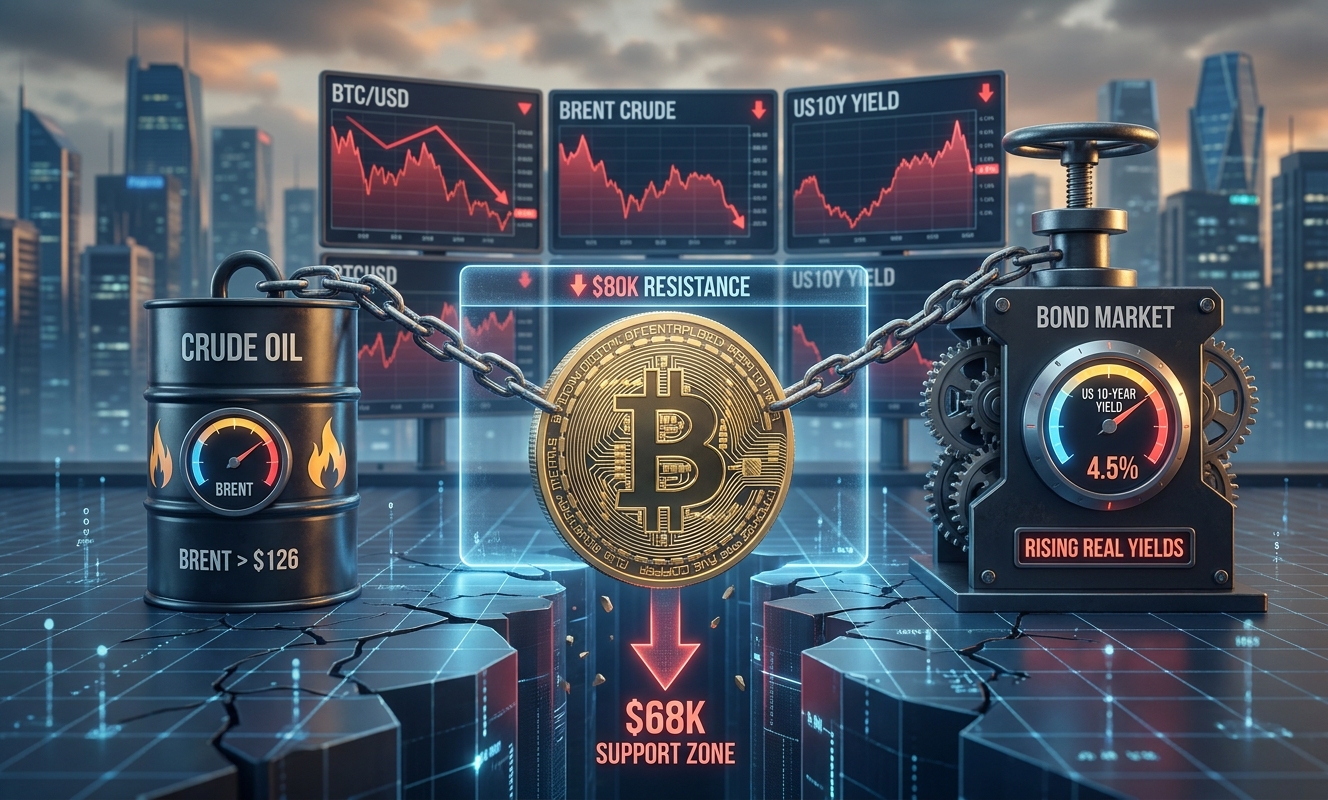
Here’s the thing most retail traders refuse to accept: Bitcoin has no coupon. No dividend. No earnings stream. Zero. It is a pure risk asset dressed up in scarcity rhetoric, and when the U.S. 10-year Treasury yield sits at 4.42% and the 30-year touches 4.98%, you are competing against a risk-free rate that’s closing in on 5%.
Think about that for a second. Institutions can park capital in U.S. Treasuries and clip near-5% yield, backed by the full faith of the federal government, while Bitcoin trades 40% off its highs with overhead supply clustering between $78,000 and $84,000. The math on why fresh capital isn’t rushing into BTC right now isn’t complicated.
The Apr. 29 official Treasury curve confirmed the squeeze is real:
That real yield number matters more than most people realize. IMF research found that Fed tightening explains roughly 80% of crypto price variation through what they call the “risk-taking channel.” When real yields rise, the price investors are willing to pay for volatility drops. Bitcoin can still bounce. But it needs overwhelming demand to fight that headwind, and right now, that demand isn’t showing up in a convincing way.
The prior CryptoSlate bond-market analysis flagged 4.35% as the tripwire, with a move toward 4.6% capable of turning the inflow streak into another failed rally at resistance. We’re already at 4.42%. The ceiling isn’t set by crypto-native dynamics right now. The bond market is literally deciding Bitcoin’s near-term fate, and most of the CT crowd is too busy looking at RSI charts to notice.
Brent crude above $126. That’s the highest since 2022. And Trump has reportedly signaled the Iran blockade could stay in place for months.
Look, a lot of people frame geopolitical oil shocks as separate from crypto. They’re not. Not anymore. Here’s the chain reaction nobody wants to spell out clearly:
That internal FOMC fracture is the rates-market version of the oil shock playing out in real time. One camp sees enough economic deterioration to ease. The other sees enough inflation risk to actually tighten the language. Bitcoin sits directly downstream from that disagreement, and neither side is offering it a clean runway.
The EIA data makes the oil situation look even worse on a structural level. The Strait of Hormuz has effectively been closed since February 28. Nearly 20% of global oil supply flows through that strait. Middle East producers were already shut in at 7.5 million barrels per day in March, rising to 9.1 million in April. EIA’s base case assumed the conflict eased after April. That assumption is now crumbling in public.
Here’s where it gets uncomfortable for the bulls. Glassnode data shows short-term holders were taking profit in the $78,000 to $79,000 zone. BTC dropped below $76,000 after the Fed decision. And the confirmed resistance zone that CryptoSlate’s prior analysis flagged, roughly $78,100 to $80,100, is now functioning as a ceiling that hasn’t been seriously challenged.
Honestly, the broader liquidity picture makes this harder to dismiss as temporary noise:
BTC dominance sitting near 59.9% tells you capital isn’t rotating into altcoins aggressively either. The broader market cap at $2.54 trillion looks stable on the surface, but underneath, the distribution of risk is getting thinner. That’s not a sign of a healthy market preparing to break out. That’s a market waiting for permission from macro.
Let’s run the scenarios without the hopium:
Between you and me, path four is what most crypto Twitter is pricing in right now. Path three is what the macro data is actually pointing toward.
The 10-year yield. That’s it. That’s the single most important number for Bitcoin’s near-term direction right now, not funding rates, not open interest, not some whale’s on-chain wallet movement.
If the 10-year eases back below 4.3%, Bitcoin’s demand story gets breathing room and the $78,000 to $80,000 zone becomes a real test. If it breaks above 4.5% while Brent crude stays above $120, Bitcoin’s ceiling is being set outside the crypto market entirely. The bond market would be doing the work that bearish traders don’t even need to do manually.
A BTC bounce from current levels doesn’t disprove this thesis. Intraday demand can temporarily push price up. Prior CryptoSlate coverage showed BTC moving with crude oil while U.S. equities were closed, then reversing hard once the S&P 500 opened. That’s not strength. That’s exit liquidity for whoever sold the bounce into real market hours.

The real danger in this setup isn’t one shock. It’s the convergence of three separate pressures landing simultaneously: Treasury supply keeping term premium elevated, oil keeping the Fed boxed in, and Bitcoin’s own overhead supply zone creating a technically weak structure for any attempted breakout. Any one of these alone would be manageable. All three running together is a different beast entirely.
If the 10-year breaks through 4.5% while crude holds above $120 and BTC can’t reclaim $78,000 on a closing basis, the next meaningful support zone isn’t pretty. The $68,000 area is the floor Glassnode’s data points to before a deeper correction path opens up. That’s not a prediction. That’s just where the structure is vulnerable if macro doesn’t cooperate.
Seriously. Open a tab for the U.S. 10-year yield alongside your BTC chart. If yields are rising and oil is sticky, don’t front-run the breakout. Let the macro confirm first. A close above $80,100 with yields stable or falling would be an actual signal worth acting on. Anything below that level in this environment is noise wrapped in hopium. Don’t be someone else’s exit liquidity while the bond market is still deciding whether risk assets deserve to exist at current multiples.
References & Sources:
While macroeconomic factors like rising Treasury yields often pressure risk assets, Bitcoin has seen periods of sudden growth driven by strong institutional adoption and significant ETF inflows. For example, Bitcoin recently surged past $73,000, fueled by hundreds of millions in weekly spot ETF inflows, effectively decoupling from traditional safe havens like gold. This strong institutional backing provides a resilient price floor, allowing Bitcoin to rise even amid geopolitical fears, high oil prices, and rising bond yields.
Rising US Treasury yields typically create headwinds for risk-on assets, including Bitcoin. When bond yields spike to multi-month or annual highs, they offer investors an attractive, risk-free return backed by the US government. This dynamic increases the opportunity cost of holding non-yielding assets, causing capital to shift away from volatile markets like cryptocurrencies. Consequently, this drains overall market liquidity and can lead to downward price pressure on Bitcoin.
Bitcoin liquidity drops when bond yields spike because institutional and retail investors reallocate their capital to capture higher, guaranteed returns in the traditional bond market. Additionally, higher Treasury yields influence broader interest rates, making borrowing more expensive. This drains excess liquidity from the global financial system. As fiat currency becomes scarcer and more expensive to borrow, the capital available for speculative trading shrinks, leading to thinner order books and reduced trading volume for Bitcoin.
In the short term, abnormally high Treasury yields are generally considered bearish for cryptocurrency markets. High yields tighten financial conditions and pull investment capital away from digital assets toward safer government bonds. However, the long-term impact can be nuanced. If rising yields occur alongside strong structural developments in crypto—such as continuous ETF inflows and growing mainstream institutional adoption—cryptocurrency markets can establish strong price floors and still thrive despite tighter macroeconomic conditions.