Subtotal $0.00

Magazines cover a wide array subjects, including but not limited to fashion, lifestyle, health, politics, business, Entertainment, sports, science,


Magazines cover a wide array subjects, including but not limited to fashion, lifestyle, health, politics, business, Entertainment, sports, science,

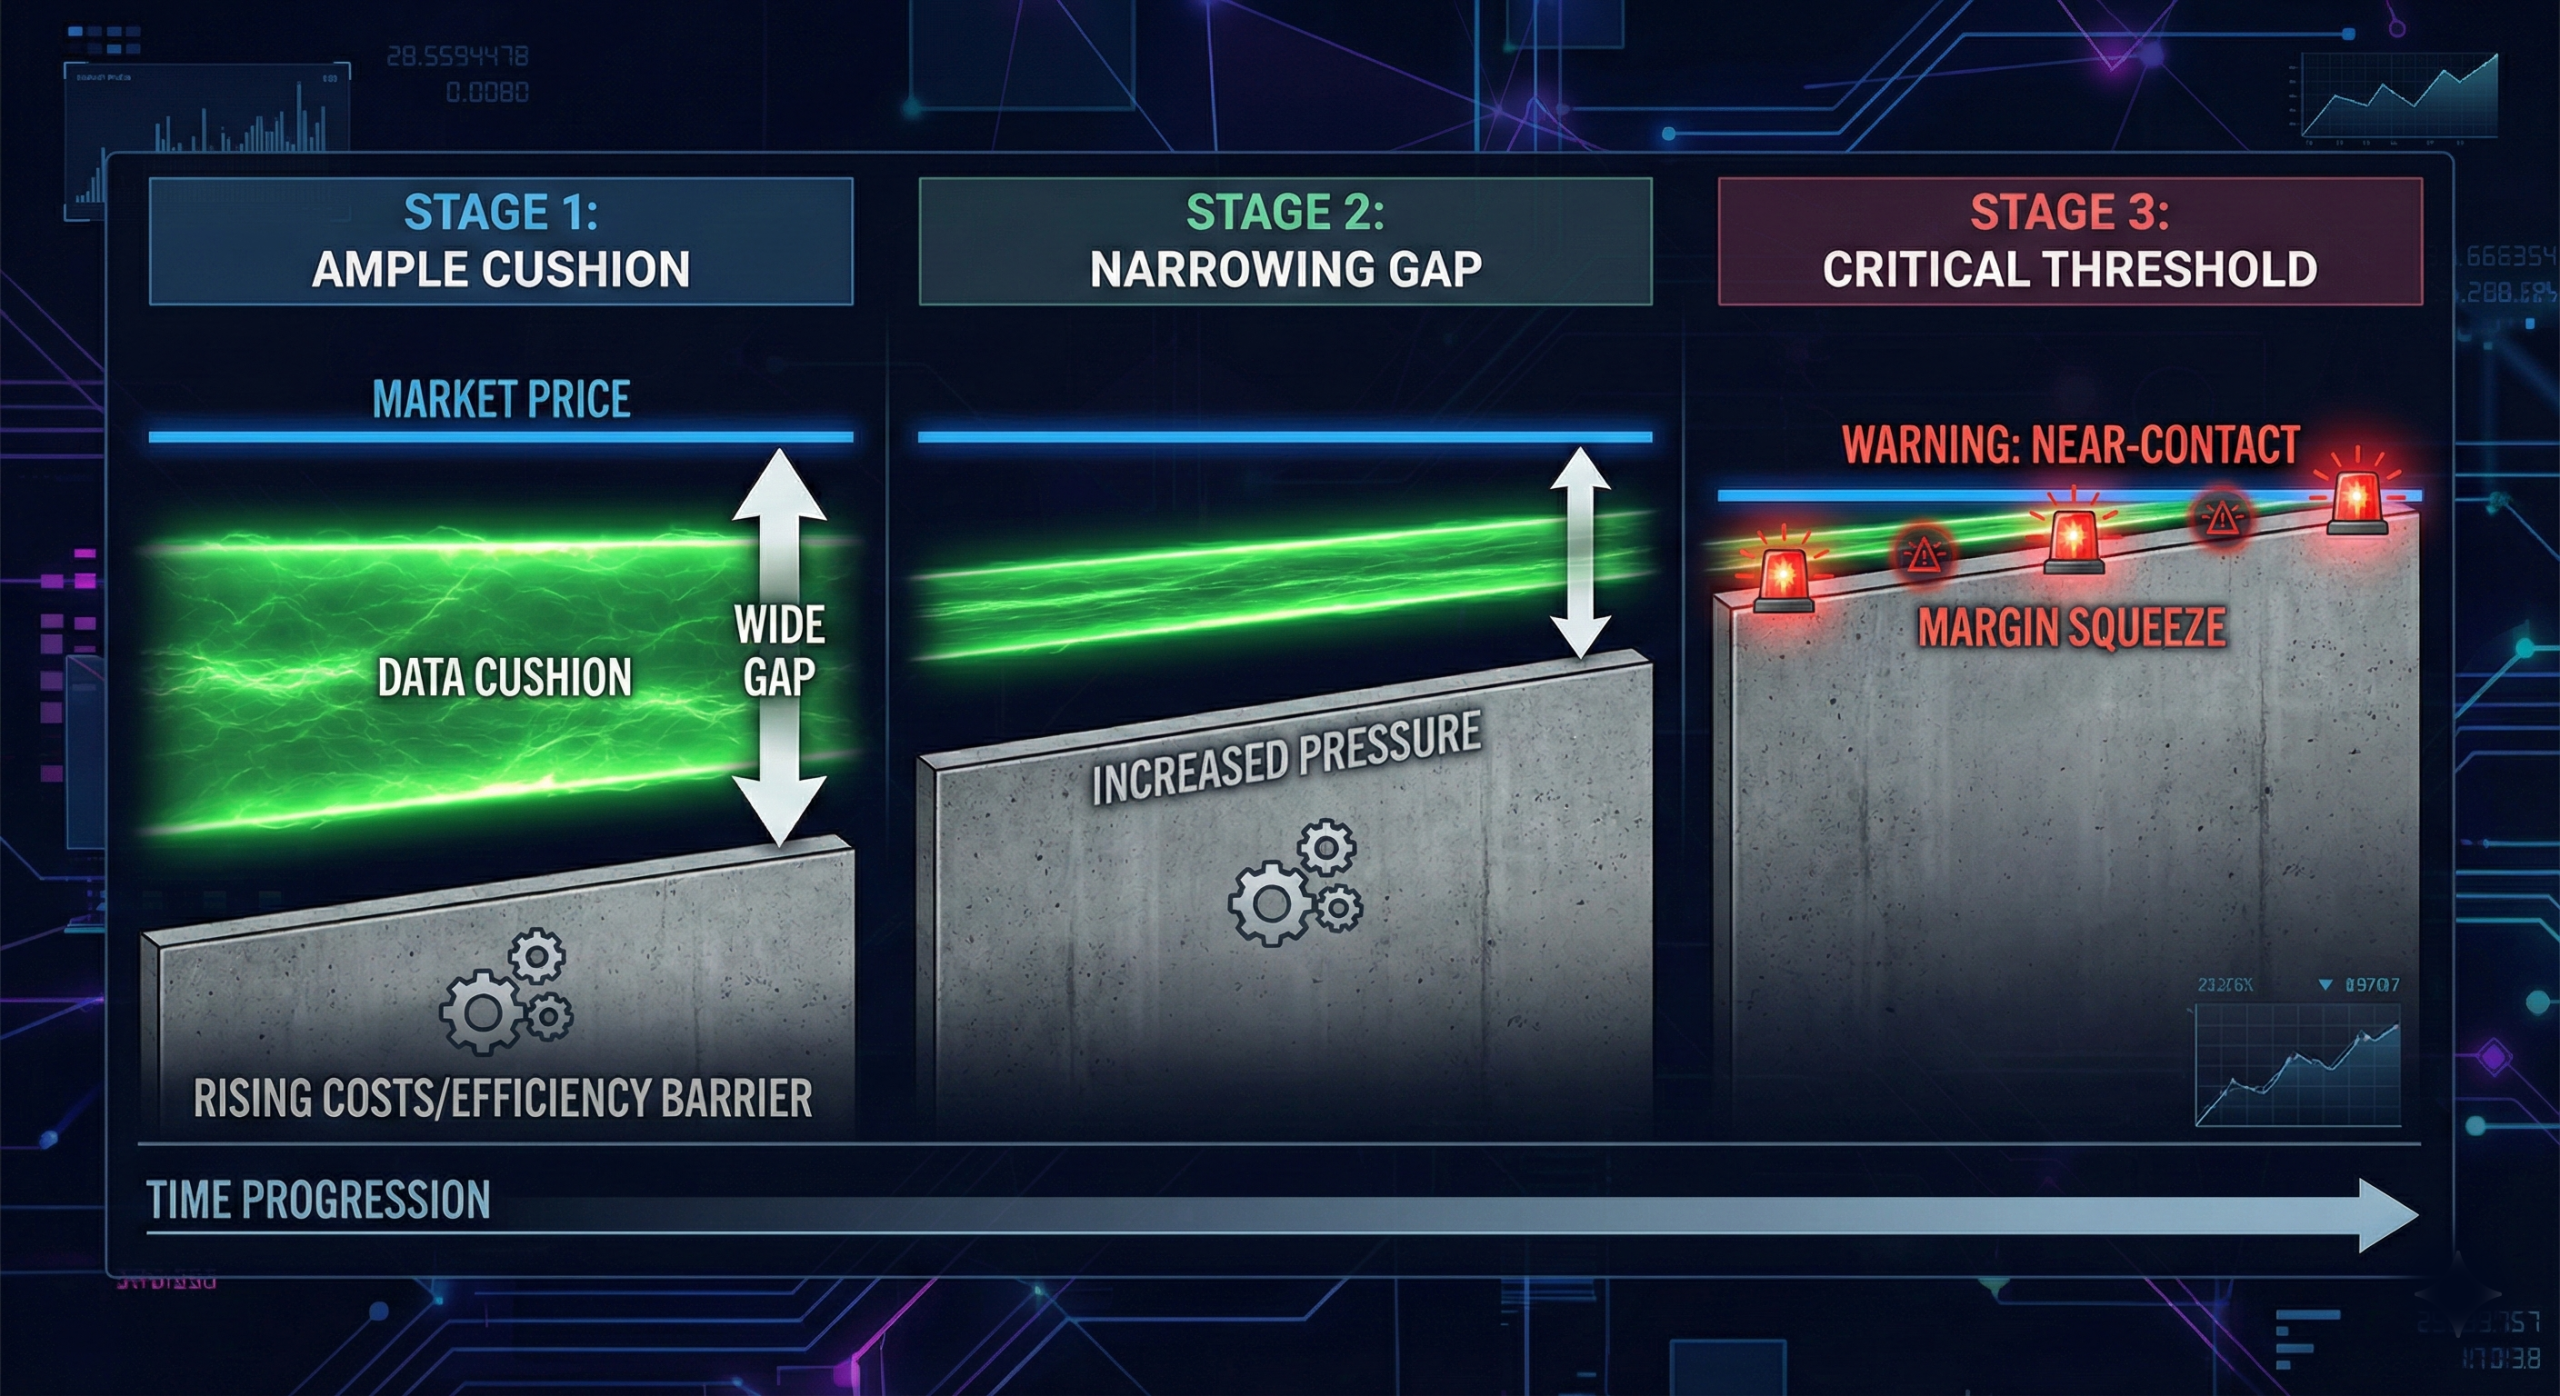
Bitcoin is sitting at roughly $67,000, and a lot of retail is calling this “consolidation.” Fine. Call it whatever helps you sleep. But here’s the thing: a model that has correctly traced Bitcoin’s entire price history is quietly, mechanically, relentlessly closing the gap beneath it. Every single day.
No whale manipulation required. No macro trigger needed. Time itself is the threat.
The Bitcoin Power Law isn’t some influencer’s back-of-napkin chart. It’s a log-log power curve regression anchored to Bitcoin’s genesis block on January 3, 2009. Astrophysicist Giovanni Santostasi built the underlying framework, and Newhedge tracks it live. The core idea: Bitcoin’s long-run price growth follows a power of roughly 5.8 relative to time elapsed since block zero.
Here’s what makes it dangerous right now. The floor doesn’t care what BTC does. It rises by approximately 0.093% per day regardless. At current price levels, that’s about $47 of upward creep per day. Slow, sure. But it adds up fast.
Look at the trajectory:
Honestly, the scariest part isn’t even the December deadline. It’s October. By late October, one sharp risk-off episode, one bad ETF outflow week, puts Bitcoin at genuine floor-test territory for the first time in its history.
Let’s be real about what’s actually driving this conversation. This isn’t just about a mathematical model. It’s about narrative control.
Fidelity’s Jurrien Timmer publicly framed ~$65,000 as a “line in the sand,” referencing power-law-style trend analysis. When an institution of Fidelity’s caliber starts using the same zone as a key level, it stops being just a quant model and starts becoming a coordination point. Traders watch it. Algorithms are programmed around it. The level becomes self-reinforcing through reflexivity.
That’s the hidden mechanic here. The Power Law floor isn’t just a passive indicator. Institutional commentary is actively weaponizing it as a psychological anchor. If enough major players treat $65,000 as significant, it becomes significant. Period.
And the bears know this. A clean “first-ever Power Law break” headline is the kind of narrative that doesn’t just shake out weak hands. It hands critics a story they can run with for months. Stock-to-Flow got destroyed when it broke. The Power Law’s defenders argue it’s more robust, more scientifically grounded. They may be right. But the market won’t care about the nuance when the chart flashes red.
Sideways markets are the silent killer here. A 20% crash would be dramatic but would also likely generate massive buy-side interest and reflexive support. But what if Bitcoin just… chops? Consolidates between $64,000 and $70,000 for six months? The floor climbs into the price range. No dramatic event needed. The clock runs out quietly.
Bitcoin’s one-month implied volatility recently sat around 51.77%. Run the math using Deribit’s DVOL rulebook: divide by the square root of 365, and you get expected daily swings in the mid-single-digit percentage range. A 4-to-6% single-day drawdown is not an outlier. It’s Tuesday. One inflation surprise, one geopolitical shock, one week of accelerated ETF outflows (already totaling $8.5 billion since October) and you’re tagging the floor immediately, without warning.
The mid-$60,000 range keeps appearing not just in power-law models but in analyst commentary, on-chain support analysis, and ETF flow discussions. When enough participants treat a price zone as significant, it attracts both buyers (who defend it) and sellers (who front-run the break). Either way, expect high-volatility confrontations at that level through Q4.
Look, I’m not here to shill a model. The Power Law has legitimate critics, and you should know who they are and why they argue what they argue.
Amdax’s Tim Stolte has made a widely circulated argument that power-law fits to Bitcoin are spurious correlations, largely products of sample window sensitivity. Fit the model to different date ranges, and you get meaningfully different parameters. A February 2026 academic preprint agreed that Bitcoin is “approximately power-law-in-time,” but found a different slope, roughly 4.2 instead of 5.8, when running 2011-to-2026 data. Different slope means a different floor. Different floor means today’s “breach” might not even register on an alternative parameterization.
This is critical. A “break” on Newhedge’s chart might look completely normal on another researcher’s version. Without pre-committing to a falsification rule (weekly close below the floor for X consecutive weeks, for example), every break can be dismissed as noise. Every bounce can be claimed as confirmation. That’s not science. That’s narrative fitting after the fact.
The model is best understood as a first-order approximation, not a prophecy. Useful for framing long-run regime analysis. Dangerous if treated as gospel.

Here’s my take, and I’m going to be direct about it. The altcoin situation looks worse than Bitcoin’s in this scenario. Historically, when Bitcoin chops sideways or threatens a key support level, altcoin correlations spike upward and altcoin liquidity drains. Capital rotates defensively. If $67,000 BTC is the level generating this much anxiety, imagine what a sustained test of $62,000-$65,000 does to mid-cap and small-cap tokens.
We’re already seeing signs of this rotation. Reports of $1.2 trillion in trading volume shifting toward Bitcoin dominance, with altcoin indices underperforming badly, confirm the defensive posture is already building. A floor-test narrative for Bitcoin doesn’t happen in isolation. It reshapes the entire market structure.
ETF flows are the other variable. US spot Bitcoin ETFs were the structural bid that held 2024 together. Those flows have materially cooled. $8.5 billion in outflows since October is not a trivial number. If that trend accelerates, it removes the primary institutional demand buffer that has been absorbing selling pressure. The power-law model assumes Bitcoin grows smoothly along a curve. Real markets have discontinuities. ETF outflows are exactly the kind of gap risk that creates those discontinuities.
Track the cushion weekly, not the price daily. The relevant number isn’t “Bitcoin is at $67,000.” It’s “Bitcoin is X% above the Power Law floor.” Watch that percentage shrink in real time on Newhedge. When it drops below 5%, you’re in active risk territory regardless of short-term price action.
Risk Factor: The single biggest danger here isn’t the Power Law breaking. It’s the narrative surrounding a potential break triggering a panic cascade before the actual breach even occurs. Markets price in fear faster than fundamentals. If the “floor test” story goes mainstream in October, you’ll likely see the vol-driven sell-off weeks before the floor is actually reached. By the time retail is reading the headlines, the smart money has already repositioned. Don’t be the exit liquidity.