Subtotal $0.00

Magazines cover a wide array subjects, including but not limited to fashion, lifestyle, health, politics, business, Entertainment, sports, science,


Magazines cover a wide array subjects, including but not limited to fashion, lifestyle, health, politics, business, Entertainment, sports, science,

 Fact Checked by Coinsbeat Editorial Team | Expert Reviewed by Themiya
The number is $0.637 billion. That’s what’s left in the Fed’s domestic overnight reverse repo facility as of March 19. For context, that pool once sat at over $2.5 trillion. It quietly cushioned every macro shock, every Treasury cash rebuild, every tightening scare for the better part of two years. Now it’s basically gone. And most Bitcoin holders have absolutely no idea what that means for them.
Every financial media outlet this week ran the same tired oil-inflation-Fed story. Sure, crude matters. But oil is the symptom everyone can see. The real structural problem is invisible to most retail traders, and that’s exactly why it’s dangerous.
Here’s the thing: the ON RRP facility, which is the Fed’s overnight reverse repo program, used to act as a massive passive release valve. When the Treasury needed to rebuild its cash balance, when bond issuance surged, when financial conditions tightened suddenly, money could drain from that pool back into reserves and risk assets. Automatically. Without the Fed having to do a single thing. It was essentially free liquidity insurance for markets.
That insurance policy just expired.
The March 18 H.4.1 data tells the full story in cold numbers:
Let’s be real. That TGA number is the other villain here. A Treasury sitting on nearly $876 billion in cash is pulling reserves out of the banking system like a vacuum. And there’s no longer a reverse repo cushion to offset it passively.
A January 2026 Fed research note was pretty blunt about this. It said changes in the TGA, the ON RRP, and the foreign repo pool affect reserve balances one-for-one unless the Fed actively offsets them. It also said money-market rates become more sensitive when reserve buffers shrink.
That’s not crypto speculation. That’s the Fed’s own economists telling you the plumbing is tighter.
And we’ve already seen proof of this dynamic in funding markets. The Fed’s own data showed SOFR spiking 25 basis points above the ON RRP rate at some quarter-ends as buffers thinned out. Quarter-end funding stress is where this always shows up first. It’s a canary. Watch it.
The FOMC held rates at 3.50% to 3.75% on March 18. Fine. But they also flagged elevated inflation and rising Middle East uncertainty in the same breath. The two-year Treasury yield ticked from 3.68% to 3.76% in a single day. That’s only eight basis points. But eight basis points hits differently when there’s no passive cushion to absorb the downstream pressure.
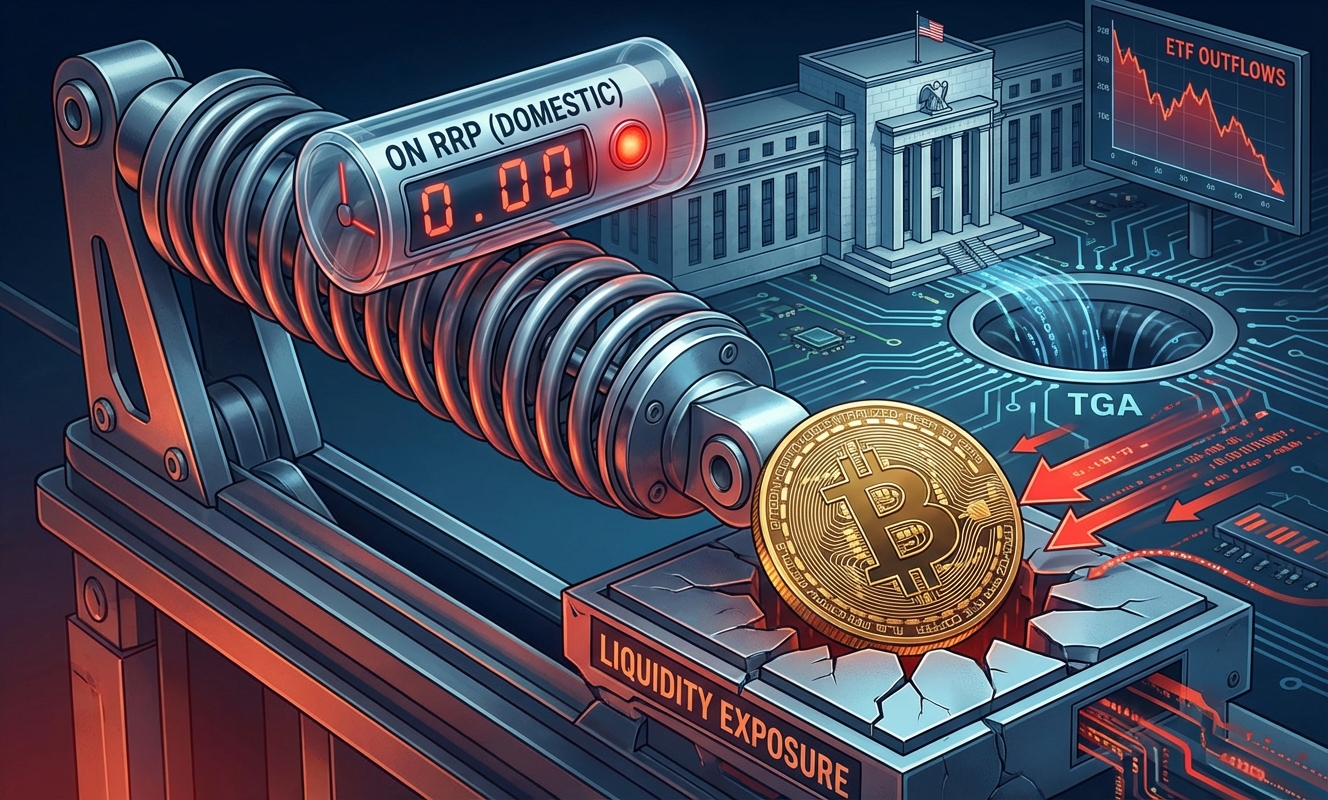
Bitcoin dipped below $70,000 this week. Spot BTC ETFs bled $253.7 million over two consecutive days. $163.5 million on March 18. $90.2 million on March 19.
Honestly, the ETF outflows alone don’t prove causation. But they don’t need to. The pattern is clear enough. Bitcoin has been trading with rates and flows for the entire ETF era. That’s not going to change. And the macro backdrop just got structurally less supportive in a way that isn’t obvious from a simple price chart.
The old regime had a built-in softener. The new regime doesn’t. The same inflation scare, the same oil spike, the same funding squeeze now travels faster and hits harder. There’s no passive buffer absorbing the first punch anymore.
Look, the Fed hasn’t been sitting still. They ended balance-sheet runoff on December 1, 2025, and started active reserve management purchases of T-bills. That’s a real offset. The New York Fed’s February 2026 reserve-demand elasticity update also said the fed funds rate’s sensitivity to reserve changes is still statistically near zero, which suggests we’re not in a genuine reserves scarcity crisis yet.
But “not a crisis yet” is doing a lot of heavy lifting as a bullish argument.
There’s a base case, a risk case, and a soft landing case. Here’s what each actually looks like right now.
Reserves stay near $3 trillion. The Fed keeps rates flat. ETF flows stay choppy. Bitcoin trades sideways to slightly lower, anchored to short-end yields and risk appetite. No blowup. Just grinding pressure with no tailwind from passive liquidity injections. This is the “stuck in the mud” scenario.
The TGA stays bloated. ON RRP stays at zero. An inflation print or a geopolitical escalation pushes short-end yields higher. There’s no passive cushion to absorb the drain. Reserves take the hit directly. Funding markets show stress at quarter-end. ETF outflows accelerate as institutional allocators reduce risk exposure. Bitcoin retests $65,000 or lower, not because of anything crypto-specific, but because the macro plumbing broke quietly while everyone was watching oil prices.
The Fed’s active T-bill purchases keep reserves stable. Quarter-end repo stays orderly. ETF flows recover. Markets decide the disappearance of the ON RRP cushion is just a mechanical plumbing change, not a new source of stress. Bitcoin recovers toward $75,000 to $80,000. Possible. But this requires the Fed to execute perfectly with active tools at a time when its passive tools just disappeared.

Forget the noise. Here are the three data series that will tell you what’s really happening before Bitcoin’s price does.
Quarter-end is the pressure point the Fed’s own research identified as the most sensitive window. March 31 is close. That’s when funding markets have historically shown the first visible signs of reserve stress as buffers thinned. If repo markets start showing SOFR spikes or funding dislocations in the final week of March, that’s not a random blip. It’s the structural warning the Fed’s own economists predicted.
A practical move: if you’re holding levered long positions into quarter-end, consider trimming. The risk-reward of carrying leverage through a potential funding shock in a market that’s already lost its passive cushion is not great. You don’t need to be a macro genius to manage that risk. You just need to know which calendar dates are structurally dangerous. March 31 is one of them right now.
Risk Factor: The biggest danger here isn’t a dramatic crash headline. It’s a slow, grinding deterioration in macro conditions that chips away at Bitcoin’s bid without a single obvious catalyst. Retail keeps buying dips expecting a bounce while institutional ETF money quietly walks out the door. That’s how exit liquidity gets built. Don’t be the exit.
References & Sources:
Falling oil prices act as a double-edged sword for the global economy. For consumers and oil-importing countries, lower energy costs act like an economic stimulus, effectively putting more money into pockets, boosting discretionary spending, and helping to tame inflation. However, for oil-exporting nations, a drop in prices significantly reduces government revenues. This often results in higher national deficits and lower public spending, which can slow global growth. Currently, while the world fixates on the immediate relief of cheaper oil, underlying financial vulnerabilities—such as the rapid draining of critical Federal Reserve liquidity facilities—threaten to overshadow these benefits and introduce severe economic friction.
Oil prices frequently experience brief periods of stabilization after significant drops, but they remain highly vulnerable to macroeconomic uncertainty and shifting supply-side dynamics. Fluctuations are heavily driven by investor sentiment surrounding global trade talks, geopolitical tensions, and the varying energy demands of major consumers like the U.S. and China. However, keeping a narrow focus on oil markets can be dangerous for investors. Broader financial stability is intrinsically tied to central bank liquidity. As key Federal Reserve cash backstops are depleted, the wider financial system faces tighter lending conditions, which could rapidly spill over into commodity markets and disrupt oil price stability.
The “critical Fed cash backstop” generally refers to Federal Reserve liquidity mechanisms like the Overnight Reverse Repurchase Agreement (ON RRP) facility. This facility acts as a shock absorber for the U.S. financial system, taking in excess cash from money market funds and providing a secure floor for short-term interest rates. Over the past year, this reserve has been draining rapidly. Its depletion matters immensely because it signals a severe reduction in excess systemic liquidity. If this crucial buffer empties out entirely, banks and financial institutions could face sudden, severe funding squeezes, potentially triggering extreme market volatility regardless of external factors like stable oil prices.
When Federal Reserve liquidity reserves dry up, the cost of borrowing typically rises, and institutional capital becomes much harder to access. This tightening acts as a brake on economic growth. For the stock market, a liquidity crunch can lead to sudden corrections as financial institutions are forced to sell off assets to raise cash. For commodities, including oil, tighter monetary conditions generally strengthen the U.S. dollar and reduce speculative demand, putting downward pressure on prices. While retail investors may be distracted by daily oil price headlines, institutional eyes are on the Fed’s dwindling cash backstop, as its exhaustion increases the risk of a broader systemic shock across all asset classes.