Subtotal $0.00

Magazines cover a wide array subjects, including but not limited to fashion, lifestyle, health, politics, business, Entertainment, sports, science,


Magazines cover a wide array subjects, including but not limited to fashion, lifestyle, health, politics, business, Entertainment, sports, science,

Nearly half of all Bitcoin in circulation is sitting at a loss right now. At $63,275. Not at $3,000. Not during the FTX dumpster fire. Right now, in a cycle that was supposed to be the one where everyone got rich.
Let that sink in for a second.
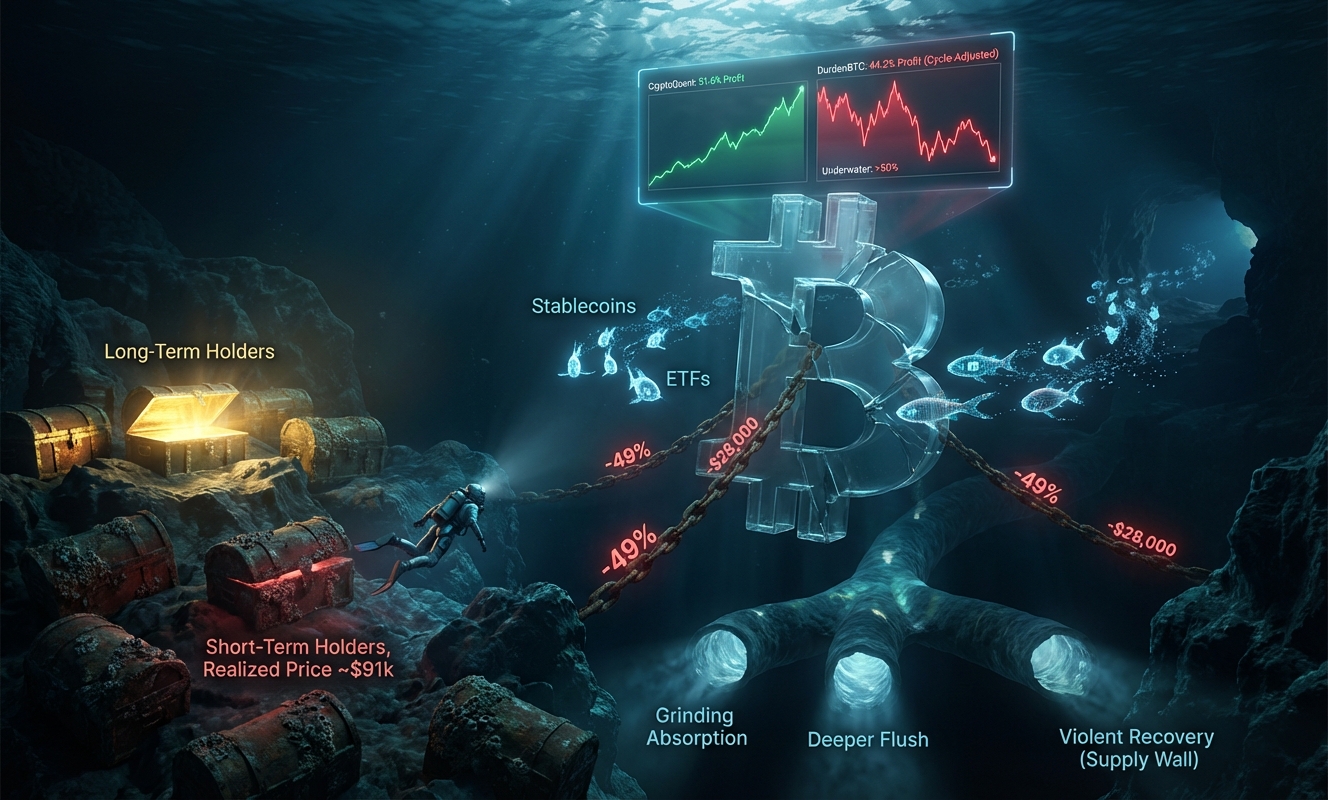
Analyst DurdenBTC flagged something brutal a few weeks back: when Bitcoin was still holding $68,000, only 44.2% of coins were in profit. A 0th-percentile reading. Historically speaking, that’s not just bad. That’s the worst reading since this specific tracker started before 2016.
For context, here’s how that stacks up against crypto’s greatest disasters:
As DurdenBTC put it directly: “BTC near $68k, more people underwater than when it traded near $3k.”
Honestly, that line should be plastered on every crypto Twitter bio that’s still shilling altcoins right now.
Here’s the thing that trips everyone up. You pull up CryptoQuant’s dashboard and it reads 51.6% in profit. Newhedge shows 51.78%. So which number is lying?
Neither, actually. But one is far more dangerous to ignore.
The gap comes down to methodology, and it matters a lot. CryptoQuant aggregates profitability across the full UTXO set, weighted by value. That means the ancient coins, the Satoshi-era wallets, the lost BTC from 2011 that nobody’s touched in 14 years, they all count. And because those coins have a cost basis of basically zero, they pull the percentage up artificially.
DurdenBTC and BGeometrics do something different. They focus on coins that actually changed hands in this cycle. They tag supply to the market price at each coin’s last on-chain move. So what you get is a brutally honest picture of the churned float. The coins real investors in this cycle actually bought and are now holding at a loss.
Think of it this way. CryptoQuant’s number includes the guy who bought 500 BTC in 2013 and never moved them. He’s technically in profit by a thousand percent. But he’s not the one panic-selling into your bid right now. The recent buyer who paid $72,000 in March 2024? That person is the problem. And Durden’s method captures exactly that cohort.

This is where the analysis stops being academic and starts being a practical map of where selling pressure comes from.
Short-term holders have a realized price near $91,000. Long-term holders sit around $38,000. The aggregate realized price is around $54,000. Bitcoin today is at $63,275, which puts it roughly 49% below the prior all-time high.
That’s deep enough to flush weak hands. But not deep enough to trigger mass capitulation from long-term holders who are still comfortably in the green.
So what you get is this ugly middle ground. A market where:
This is quiet capitulation. Not the spectacular kind with liquidation cascades and exchange outages. The slow, grinding kind where small wallets go flat, positions bleed out, and the bid keeps thinning.
Glassnode’s structural markers frame the current position clearly. The True Market Mean sits near $79,000. The Realized Price is near $54,000. Bitcoin is currently wedged between these two levels, in a corridor where recovering buyers are trying to get back to flat while long-term capital watches from the sidelines.
Inside that corridor, there’s a dense URPD cluster between $66,900 and $70,600. At $63,000 spot, that entire cluster is overhead resistance. It’s not just technical resistance either. It’s a wall of receipts from buyers who need price to return to their cost basis before they feel anything other than dread.
And above that? CryptoSlate’s supply analysis puts the really heavy overhead between $93,000 and $110,000, with a short-term holder cost basis near $98,300. That’s where break-even selling turns into a structural ceiling.
Look, every rally in this environment has to physically chew through layers of exit liquidity before it can sustain any upward momentum. That’s not a sentiment problem. That’s a math problem.
On-chain profitability collapse is bad enough on its own. But it’s colliding with a deteriorating demand picture that makes the supply overhead even harder to absorb.
Capital isn’t deploying aggressively. It’s retreating. The stablecoin data is probably the most telling tell here. When $4 billion exits exchanges in dry powder form, that’s investors choosing the bench over the game. Nobody panic-moves that much capital into stablecoins because they’re feeling bullish.
Price holds the $60,000 to $69,000 demand band. Realized losses slow down. ETF flows stabilize near flat. Vol compresses from current elevated levels around 70% implied. The market’s test in this scenario is whether it can reclaim and hold $66,900 to $70,600, not as a wick, but as a sustained level. That’s the first proof-of-life a recovery narrative needs.
Price loses the bottom of the demand zone with momentum behind it. Liquidations accelerate. Miners with tight margins start hitting the market with treasury sales. The tape trades toward the Realized Price near $54,000 to $55,000. Historically, that’s where longer-term capital has stepped in to rebuild positions. Painful? Yes. But structurally it’s also where genuine accumulation tends to happen.
Price rips back through the True Market Mean near $79,000. ETF flows flip positive. Stablecoin capital redeploys. But here’s the catch in this scenario: the moment price approaches $93,000 to $98,300, the break-even sellers from this cycle flood the tape. That’s not a ceiling you punch through on the first try without serious institutional buying volume behind it.
Rate cut expectations are drifting toward 3% terminal by most estimates. The Bank of England is leaning toward further cuts. On paper, easing is supposed to be a tailwind for risk assets including Bitcoin.
But let’s be real. Macro tailwinds take time to filter through into crypto order books. The on-chain pipes matter more right now than Fed expectations. ETF flows, stablecoin deployment, and spot demand are what actually move the needle on price. And all three are currently pointing toward defense, not offense.
The tariff environment adds an extra layer of noise. The pattern of dollar down, gold up, and Bitcoin down during tariff stress events tells you something important: Bitcoin is still being treated as a risk-on asset in macro stress scenarios, not a safe haven. That framing keeps it correlated to equities in the worst possible moments.
The most underappreciated risk right now isn’t a black swan. It’s something quieter and more predictable. Every rally produces its own ceiling because the underwater holders from this cycle are simply waiting to get their money back. They’re not bull market buyers. They’re hostages waiting for the door to open.
With short-term holder cost basis near $91,000 and BTC at $63,000, there’s roughly $28,000 of upside where selling pressure increases mechanically with every green candle. Institutions with ETF exposure are in the same boat. That’s not whale manipulation in the traditional sense. It’s just the arithmetic of a cycle where too many people bought too high and are now sitting on losses while nominally expensive prices keep retail from stepping in aggressively.
The implied vol cone makes this concrete: at 70% annualized IV, the one-month range puts BTC somewhere between $50,600 and $76,000. That’s not a small range. It means the market is pricing in serious uncertainty in both directions. Protect your downside accordingly.
If you’re using CryptoQuant’s percent supply in profit as your primary sentiment gauge right now, you’re looking at a smoothed-out picture that flatters the situation. That 51.6% reading includes dormant coins that haven’t moved in a decade. They’re not your competition in this market. The recent buyers who overpaid are.
Track DurdenBTC’s cycle-adjusted metric or BGeometrics’ version as your primary lens. When that number starts recovering meaningfully above 50%, with ETF inflows turning consistently positive and stablecoin exchange balances growing, that’s the combination worth paying attention to. Until then, assume every rally is fighting headwinds from underwater holders who just want their cost basis back.
Between you and me, the market structure right now rewards patience over aggression. The bid that flickers is not the bid you want to chase.