Subtotal $0.00

Magazines cover a wide array subjects, including but not limited to fashion, lifestyle, health, politics, business, Entertainment, sports, science,


Magazines cover a wide array subjects, including but not limited to fashion, lifestyle, health, politics, business, Entertainment, sports, science,

 Fact Checked by Coinsbeat Editorial Team | Expert Reviewed by Themiya
The shorts are piling in. Funding rates just hit their most negative reading since 2023. And Bitcoin, somehow, isn’t collapsing. That contradiction is the most important thing happening in crypto markets right now, and most retail traders are completely missing what it means.
Here’s the thing about deeply negative funding rates. They don’t just signal fear. They signal that a specific group of leveraged traders is paying a daily toll to bet against the market. When that group is wrong, they get squeezed out fast, and the exit isn’t pretty.
Alphractal’s Market Capitulation Oscillator just dropped into the same extreme zone it visited near the 2015 bear-market bottom, the late-2018 washout, and the 2022 low. Look, you can argue about whether a historical chart pattern is predictive. Fair point. But when you layer that signal on top of a seven-day average funding rate of roughly -0.008% (the weakest print since 2023, per Crypto.com’s data), the setup starts to look less like coincidence and more like a genuine positioning flush.
Glassnode confirmed the same thing independently. Negative funding persisted even as spot conditions improved and Bitcoin stabilized. That’s unusual. Normally, when price recovers, the shorts cover and funding normalizes. The fact that it hasn’t means the bearish conviction in derivatives is running way ahead of what spot markets are actually doing.
That divergence is the core of the bull case here. Not hopium. Not shilling. Just basic market mechanics.
This is the part that actually matters, and it’s getting buried under the macro noise.
By early March, U.S. spot Bitcoin ETFs had already bled roughly $3.8 billion over five consecutive weeks of outflows. That’s not a small rotation. That’s a serious institutional de-risking event. The weak hands got shaken out at institutional scale.
Then look at what happened next:
That’s over $1.3 billion flowing back in across three sessions, while retail sentiment was still sitting in a ditch and derivatives traders were actively paying to stay short. Honestly, that pattern doesn’t look like exit liquidity. It looks like selective re-engagement from larger allocators who had already taken their losses earlier and are now repositioning at lower levels.
That’s a meaningful distinction. It means the institutional reset already happened. The 5-week outflow streak was the purge. What we’re seeing now is the rebuild phase, and it’s quiet enough that most people aren’t paying attention to it yet.
Let’s be real, though. None of the above guarantees anything. The setup is constructive. The macro backdrop is not.
The IMF’s April 2026 World Economic Outlook didn’t mince words. Broader geopolitical conflict, fragmentation, and trade tensions could significantly weaken global growth and destabilize financial markets. That warning lands directly on top of Bitcoin’s recovery attempt. A short squeeze can still happen in a deteriorating macro environment. A sustained bull market almost certainly can’t.
Then there’s the Fed. March meeting minutes showed the committee holding the federal funds rate at 3.5% to 3.75%, still focused on incoming data, still cautious. That’s not an easing cycle. Historically, Bitcoin and high-beta assets broadly reprice with serious conviction when liquidity conditions are loosening aggressively. Right now, that’s not what’s happening. Coinbase Research’s April outlook made the same call, arguing that near-term crypto price action is being driven more by macro headlines than by anything crypto-native.
So the ceiling is real. Positioning stress can push Bitcoin higher. But sustaining a broader expansion requires macro cooperation, and the macro right now is offering anything but cooperation.
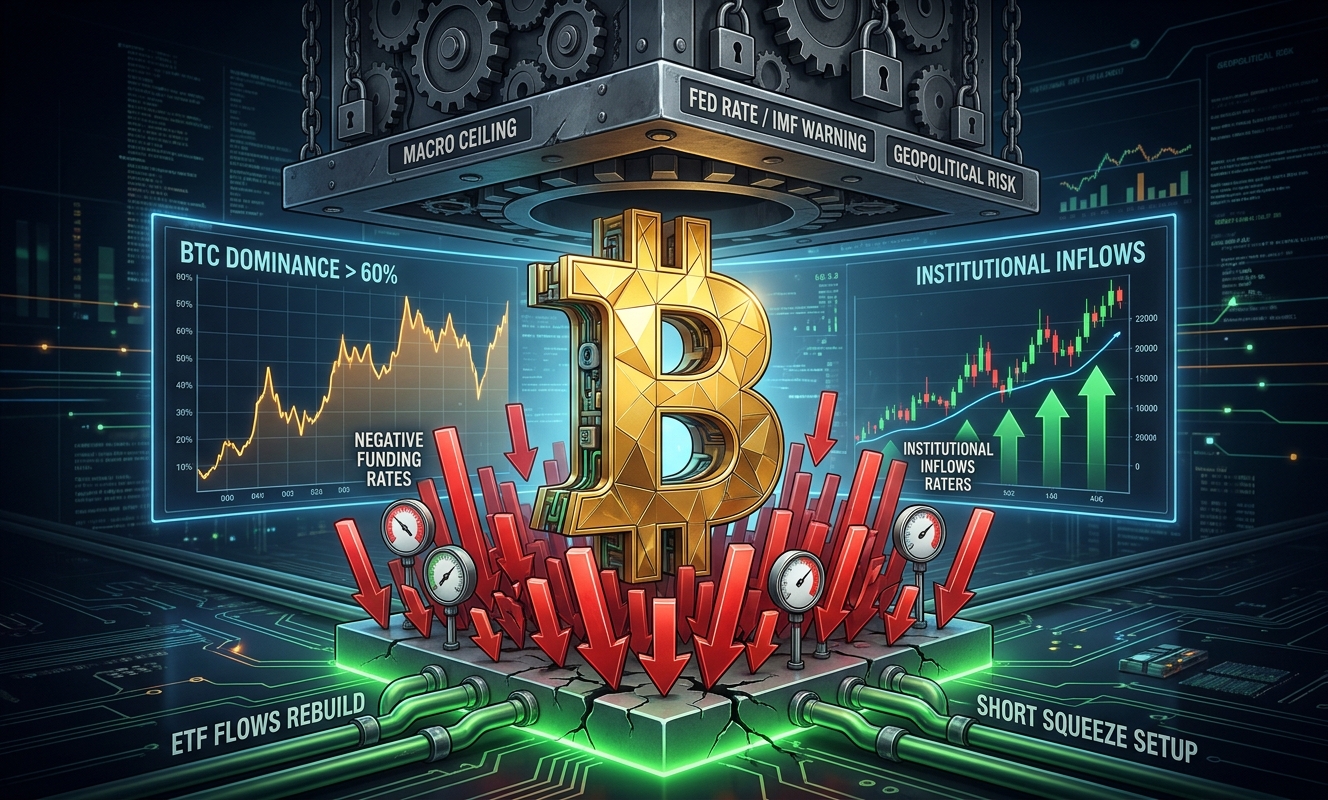
BTC dominance sitting above 60% isn’t a bullish signal for altcoins. It’s the opposite. It means capital is concentrating in the most liquid, most regulated, most defensible asset in the space. That’s what investors do when they’re nervous. They don’t rotate down the risk curve into small-caps and meme coins. They park money in the asset closest to a commodity.
The broader altcoin market is not ready for a full expansion. The data makes that clear.
If a broader bull phase develops, it will likely start narrow. Bitcoin leads. Stablecoins stay elevated. Altcoins lag until the macro gives a clearer green light. That’s the structure of this market, and fighting it is a reliable way to become someone else’s exit liquidity.
There’s no clean answer to whether Bitcoin is at a durable bottom or a squeeze that burns itself out. But the scenarios are well-defined, and knowing which one you’re in matters enormously for how you position.
Scenario A (Durable Bottom): ETF inflows continue building. Funding stays negative or normalizes slowly. Macro stress stabilizes or eases. Short sellers keep getting squeezed higher until the pain forces a full cover. Bitcoin consolidates above $80,000 and begins establishing it as support.
Scenario B (Squeeze, Then Failure): Inflows fade after this initial burst. Geopolitical risk spikes again. Fed signals stay restrictive or tighten. The rebound exhausts itself in the $82,000 to $88,000 range and Bitcoin rolls back over. The washout wasn’t deep enough, and the market needs one more leg lower to clear the remaining bagholders from the 2025 ATH.
Between you and me, both of these are live. The data supports reading this as closer to a bottom than the derivatives crowd expected. But it absolutely does not support calling a new full-cycle bull market just yet.

The short squeeze setup is the near-term trade. The macro ceiling is the medium-term risk. Here’s how to think about sizing between them.
Here’s the catch nobody wants to talk about. The IMF warning about geopolitical fragmentation isn’t abstract. Energy prices feeding back into inflation expectations, renewed trade tensions forcing central banks to stay hawkish longer than expected, or a sudden escalation in global conflict risk can all simultaneously crater the ETF inflow thesis.
Institutional allocators who are dipping back in right now are doing so cautiously. They are not fully committed. If macro headlines deteriorate sharply over the next four to six weeks, those same allocators will pull out again, faster than they came in, and retail traders holding spot bought during this bounce will absorb the selling pressure.
That’s the real whale manipulation risk in this setup. Not overt market manipulation, but the structural reality that large allocators can reverse direction faster than most retail participants can react. The negative funding crowd got that part right, even if their timing has been working against them.
Bitcoin looks like it’s closer to a tradable bottom than the market expected. But “closer to a bottom” and “confirmed bull market” are two completely different statements. The market hasn’t earned the second verdict yet.
References & Sources:
Analysts often use historical halving cycles, technical indicators, and macroeconomic liquidity trends to predict Bitcoin’s price movements. The timeline of being “21 days away” refers to a specific cyclical breakout window, usually following a lengthy post-halving consolidation phase or a shift in global monetary policy, such as interest rate cuts. When historical chart patterns align with current on-chain metrics, experts use these specific timeframes to forecast the exact moment Bitcoin will transition from sideways trading into a massive, aggressive upward price rally.
Short sellers, or “shorts,” pile into the market when they anticipate a price drop, heavily relying on short-term bearish signals or local resistance levels. However, in an aggressively volatile asset class like cryptocurrency, a high concentration of short positions can actually act as rocket fuel for a price surge. If spot buyers continue to push the price above critical resistance levels, it triggers a “short squeeze.” This forces short sellers to urgently buy back Bitcoin to cover their losing positions, thereby artificially accelerating the bullish momentum and driving prices even higher.
Spot demand refers to investors and institutions buying actual, underlying Bitcoin on exchanges for immediate settlement, rather than simply trading speculative derivatives or futures contracts. Strong spot demand creates a genuine reduction in the available circulating supply. When short sellers attempt to drive the price down with leveraged paper trades but are met with overwhelming spot buying, their downward pressure is entirely neutralized. This “push back” from spot buyers establishes a rock-solid price floor and is often the primary catalyst that absorbs selling pressure and triggers an explosive upward breakout.
A genuine, long-term Bitcoin bull market is characterized by several distinct indicators: sustained increases in spot buying volume, higher highs and higher lows on macroeconomic charts, and massive institutional accumulation (such as billions of dollars in ETF inflows). Additionally, significant short liquidations and on-chain metrics—like the steady movement of coins from short-term speculators into the cold wallets of long-term “hodlers”—serve as undeniable proof that the market has exited its accumulation phase and entered a full-blown parabolic rally.