Subtotal $0.00

Magazines cover a wide array subjects, including but not limited to fashion, lifestyle, health, politics, business, Entertainment, sports, science,


Magazines cover a wide array subjects, including but not limited to fashion, lifestyle, health, politics, business, Entertainment, sports, science,
 Fact Checked by Coinsbeat Editorial Team | Expert Reviewed by Themiya
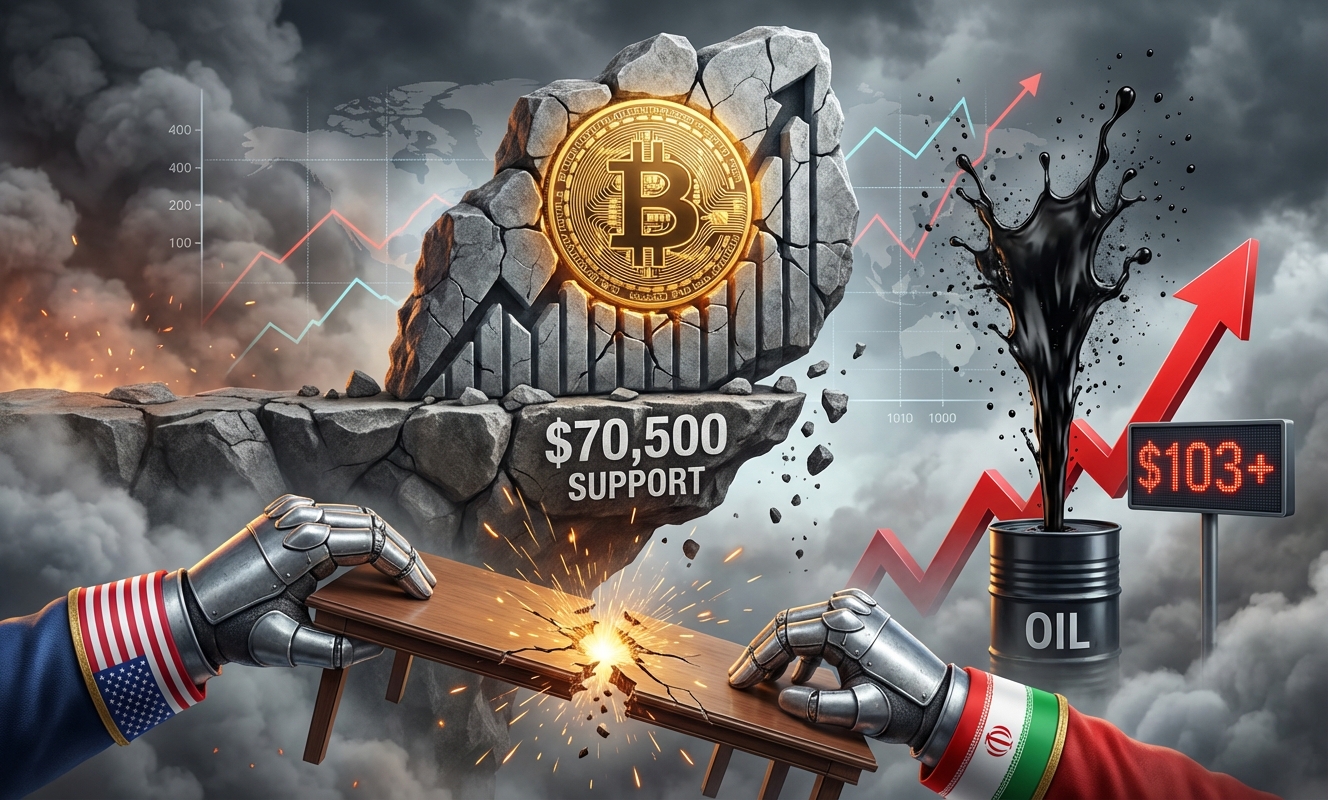
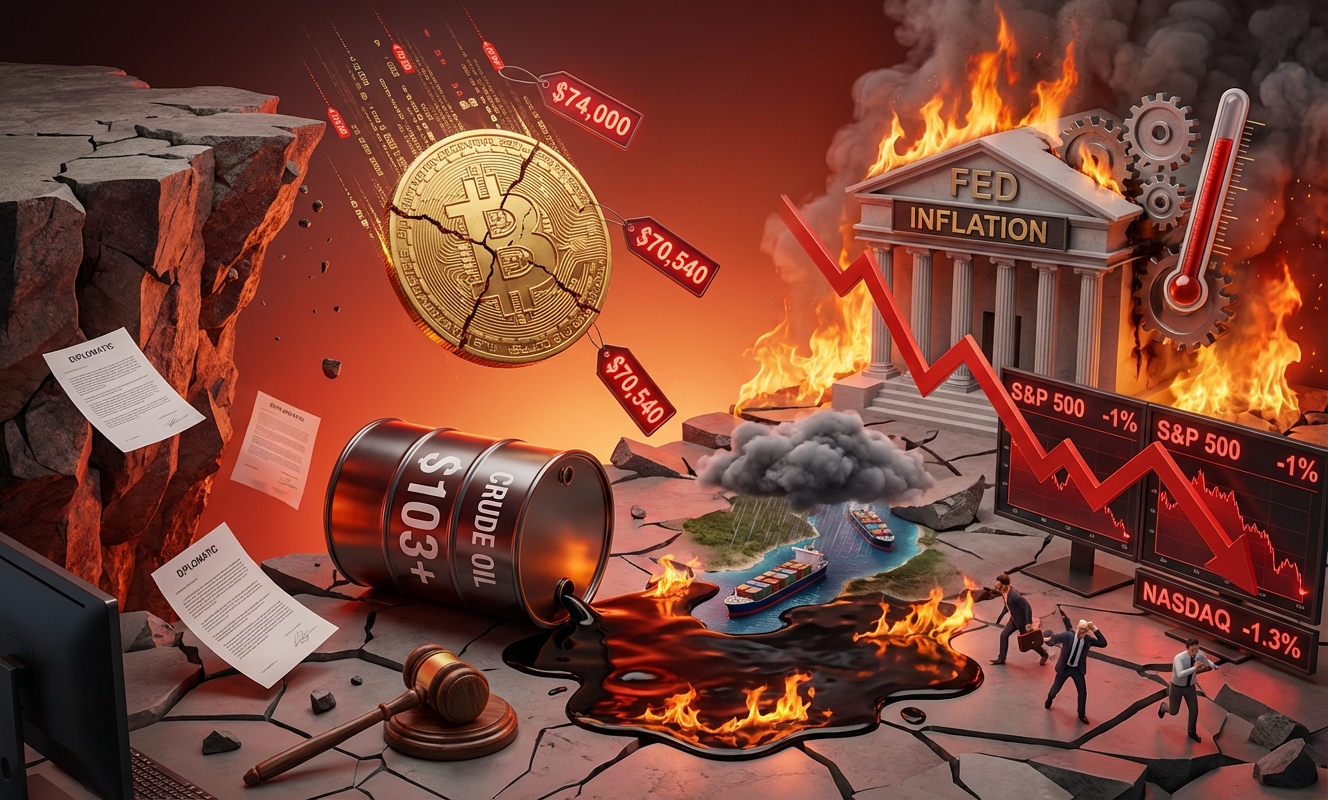
The ceasefire honeymoon lasted about a week. Then JD Vance walked out of Islamabad without a deal, CENTCOM started blocking Iranian port traffic, and Bitcoin fell off a cliff from $74,000 to $70,540 before most of the Western world had finished their Sunday morning coffee. This wasn’t a random crypto sell-off. This was a geopolitical event repricing every risk asset on the planet simultaneously.
Let’s be real. The market didn’t just sell off because diplomacy failed. It sold off because the failure of those Islamabad talks removed the one thing propping up the entire post-ceasefire rally: the expectation of durable de-escalation.
Think about the chain reaction. No Iran deal means the conflict drags on. A prolonged conflict means sustained disruption around the Strait of Hormuz, which carries roughly one-fifth of global oil and gas supply. Sustained disruption means sticky energy prices. Sticky energy prices feed into inflation. And hot inflation keeps the Fed’s foot on the brake. Tighter financial conditions for longer is just about the worst possible environment for speculative, liquidity-sensitive assets.
Brent crude ripped above $103 a barrel. US oil broke $105 at the open, a 10% jump in a single session. That’s not a bump. That’s a signal that energy markets are genuinely frightened. And when crude goes to triple digits with that kind of velocity, crypto traders don’t sit around waiting to see what happens next. They sell first and ask questions later.
This is the macro chain Bitcoin is now shackled to. Oil up, inflation fears up, rate cut hopes down, risk appetite down, Bitcoin down. It’s that simple. And honestly, anyone still treating BTC as an isolated asset class that moves on its own internal fundamentals hasn’t been paying attention for the last two years.
Here’s the thing most people are missing in the headlines. The geopolitical shock was the trigger, sure. But the gun was already loaded. Bitcoin’s market structure heading into this weekend was not healthy.
Glassnode data puts approximately 13.5 million addresses in a loss position at the $70,800 price level. That’s a massive overhang of underwater holders who are going to use any recovery bounce as exit liquidity. Every time BTC has tried to push through the $70,000 to $80,000 band recently, profit-taking has emerged almost instantly, with more than $20 million in realized profit per hour getting dumped into rallies. That is not a market that wants to go up.
Alphractal’s CEO Joao Wedson flagged something worth paying close attention to. After a liquidity sweep above $73,000, bearish traders piled in aggressively with high leverage short positions. That pool of liquidity still sits above $75,000. And CryptoQuant recorded nearly $1 billion in sell volume hitting Binance derivatives within a single hour after the failed talks became public knowledge. One billion dollars. In one hour. On one exchange’s derivatives market.
Funding rates are negative, sitting around -0.0065%. Short positions dominate short-term positioning right now. Historically, that kind of crowded short setup can create the conditions for a squeeze. But look, in bear market conditions those squeezes tend to be quick, shallow, and brutal for anyone who chases them too aggressively.
BRN’s head of research Timothy Misir laid it out cleanly. Stability above $70,000 keeps the door open for faster upside. A break below it reinforces the current range and extends what is already starting to look like a painful consolidation phase grinding through the $70k to $80k corridor.
BTC Markets analyst Rachael Lucas put the immediate support zone at $70,500 to $71,000. Hold that and a move back toward $72,000 to $73,000 is plausible. But “plausible” and “probable” are very different words right now.
Okay, it’s not all doom. There’s one data point that genuinely warrants attention.
US-listed Bitcoin ETFs posted their strongest weekly inflows since February in the week ended April 10, pulling in $786 million total. BlackRock’s iShares Bitcoin Trust alone accounted for $612 million of that. Morgan Stanley’s freshly launched MSBT fund added $46 million in its first three trading days, which is a decent start for a product backed by 16,000 financial advisers and a 0.14% fee structure.
That institutional demand is real. It provides a genuine absorption mechanism when older holders decide to sell the rips. But here’s where I’d pump the brakes on the optimism. ETF inflows are a slow, steady force. Geopolitical shock and macro repricing are fast, violent forces. In the short term, the fast forces win. The ETF bid matters more over weeks and months, not over hours and days when oil is spiking 10% at the market open.
Analysts at BIT Official drew an interesting parallel to 2025 patterns, noting that similarly flat early-year ETF flows were followed by a surge of nearly $30 billion that powered a major rally. Interesting data point. But a historical parallel is not a guarantee, and the macro backdrop in the current environment has a few more live grenades in it than most people are pricing.
CryptoQuant also flagged that Bitcoin is currently sitting below the 20th quantile of its power-law model, with a reading of 18.5%. In plain language, Bitcoin has historically traded at similar valuation levels relative to this framework only 18.5% of the time. That’s a longer-term signal suggesting deep value on an extended horizon. It does absolutely nothing to protect you against the next missile strike headline or crude spike next week.
Don’t think this was a Bitcoin-specific story. Ethereum, XRP, and Solana all dropped more than 3% during the same window. The S&P 500 fell roughly 1%. The Nasdaq 100 dropped 1.3%. This was a coordinated risk-off move across every asset class that has any sensitivity to growth, inflation, or liquidity conditions.
Bitcoin dominance sitting at 58.75% tells you something. When macro fear hits, capital doesn’t flee to altcoins. It consolidates into BTC or exits crypto entirely. Alts are getting hit harder on a percentage basis and recovering slower. If you’re holding a basket of smaller caps right now hoping for a bounce, you’re competing against a macro environment that does not care about your token’s roadmap or its latest partnership announcement.

This is the part that should be keeping traders up at night. The ceasefire runs until April 22. That’s not far away. The Islamabad talks collapsed. Both sides are publicly blaming each other. Iran’s state media is calling US demands unreasonable. Washington says Tehran wouldn’t accept terms.
There is currently no visible diplomatic path to a deal before that expiry date. If April 22 arrives without an extension or a framework agreement, markets are going to reprice the conflict risk all over again. Oil could see another leg higher. Bitcoin could see another leg lower. The $70,000 support level that analysts are watching like a hawk could get tested hard.
Between you and me, the market is not pricing a clean resolution here. It’s pricing a muddle. But a muddle where the ceasefire expires without warning and crude spikes to $110 overnight is not something the current BTC market structure can absorb without significant pain below $70,000.
Watch the calendar. Watch the oil market. And keep your position sizing honest.
References & Sources:
Geopolitical tensions heavily influence global financial markets, and cryptocurrencies are no exception. Reports surrounding the Iran conflict, including the recent collapse of US-Iran talks, create significant market volatility. Interestingly, Bitcoin has demonstrated remarkable resilience during these geopolitical shocks by clinging to its critical $70,500 support level. While traditional markets may stumble, many investors increasingly view Bitcoin as a decentralized safe-haven asset and a hedge against regional instability, which can drive its price upward alongside climbing commodities like oil.
The monumental surge that previously drove Bitcoin’s price above the $100,000 threshold was largely fueled by massive institutional demand following the approval and launch of spot Bitcoin ETFs. When institutional and retail investors pour capital into these ETF products, the funds are required to purchase underlying spot Bitcoin, creating intense market demand and price appreciation. While short-term price action is currently dominated by macroeconomic events—such as oil spiking past $103 a barrel and Middle East tensions—sustained ETF inflows remain the primary foundational driver for Bitcoin’s six-figure surges.
When global oil prices spike, such as the recent surge past $103 per barrel triggered by collapsing US-Iran negotiations, it typically stokes fears of rising global inflation and increased energy costs. For Bitcoin, the impact is twofold. On one hand, rising inflation fears highlight Bitcoin’s appeal as a decentralized store of value, often referred to as “digital gold,” which encourages buying pressure. On the other hand, the threat of central banks raising interest rates to combat energy inflation can trigger sell-offs in risk-on assets. Despite these conflicting pressures, Bitcoin has managed to maintain its strength, successfully holding support at $70,500.
The $70,500 mark represents a critical technical and psychological support zone for Bitcoin. In technical analysis, a support level is a price point where concentrated buying interest is strong enough to absorb and overcome selling pressure. Clinging to $70,500 amidst severe macroeconomic headwinds—such as the breakdown in US-Iran diplomacy and surging crude oil prices—demonstrates tremendous underlying market resilience. If buyers continue to aggressively defend this level, it establishes a solid foundation that could pave the way for a bullish reversal and future upward momentum.